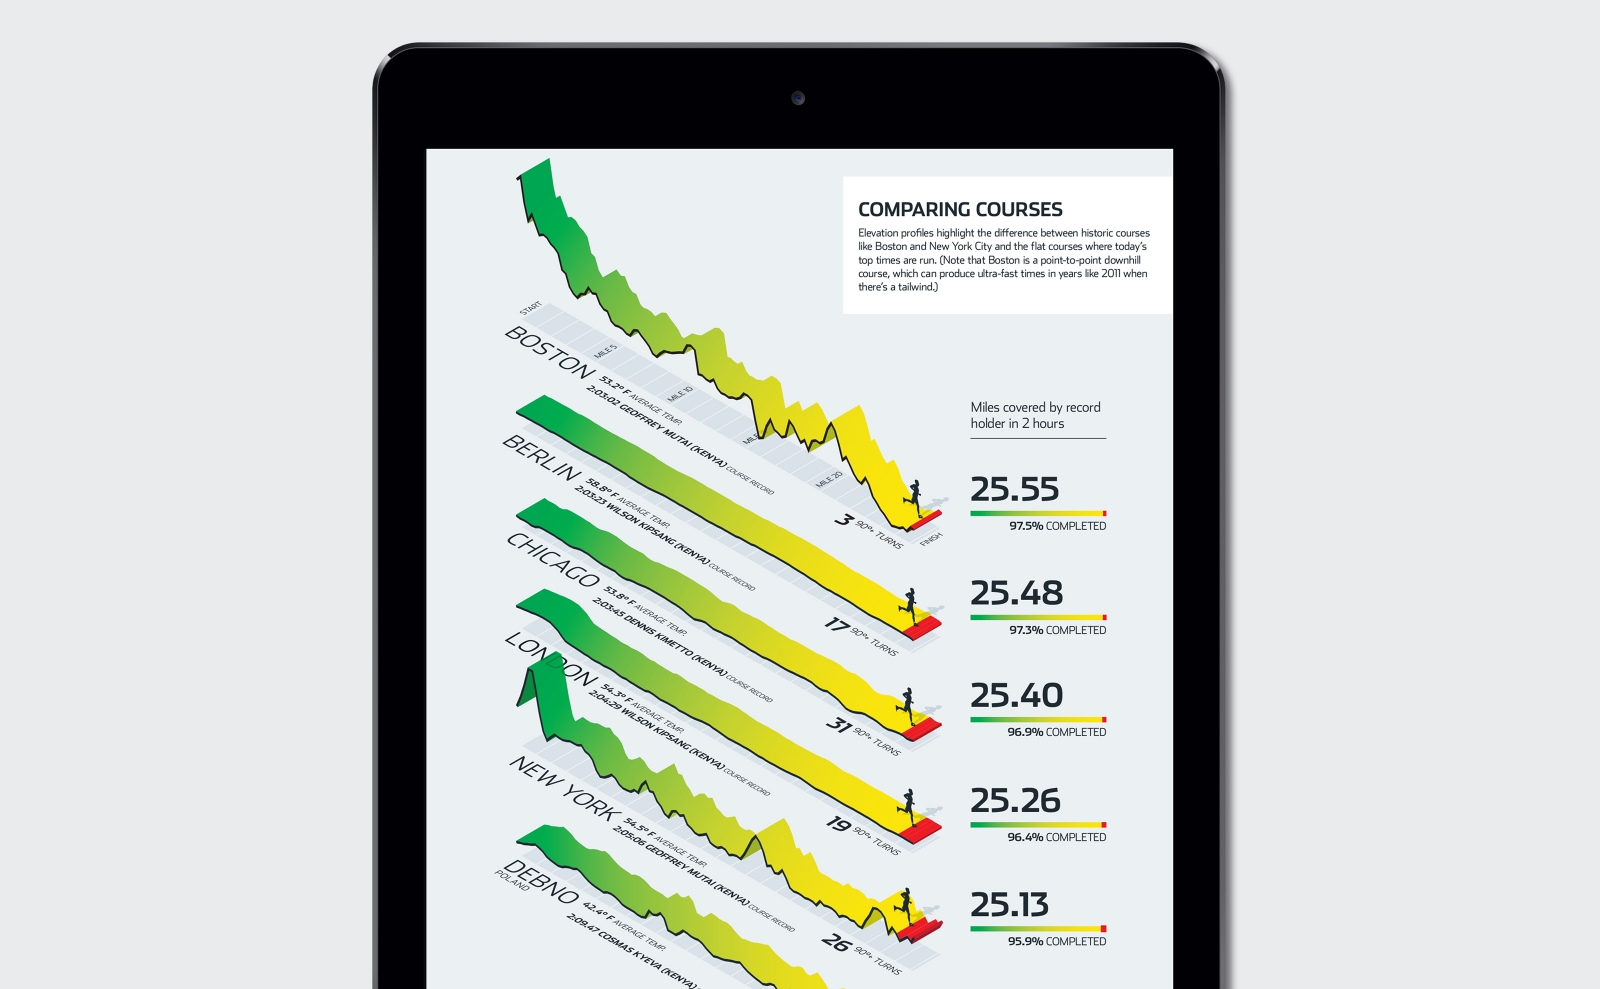
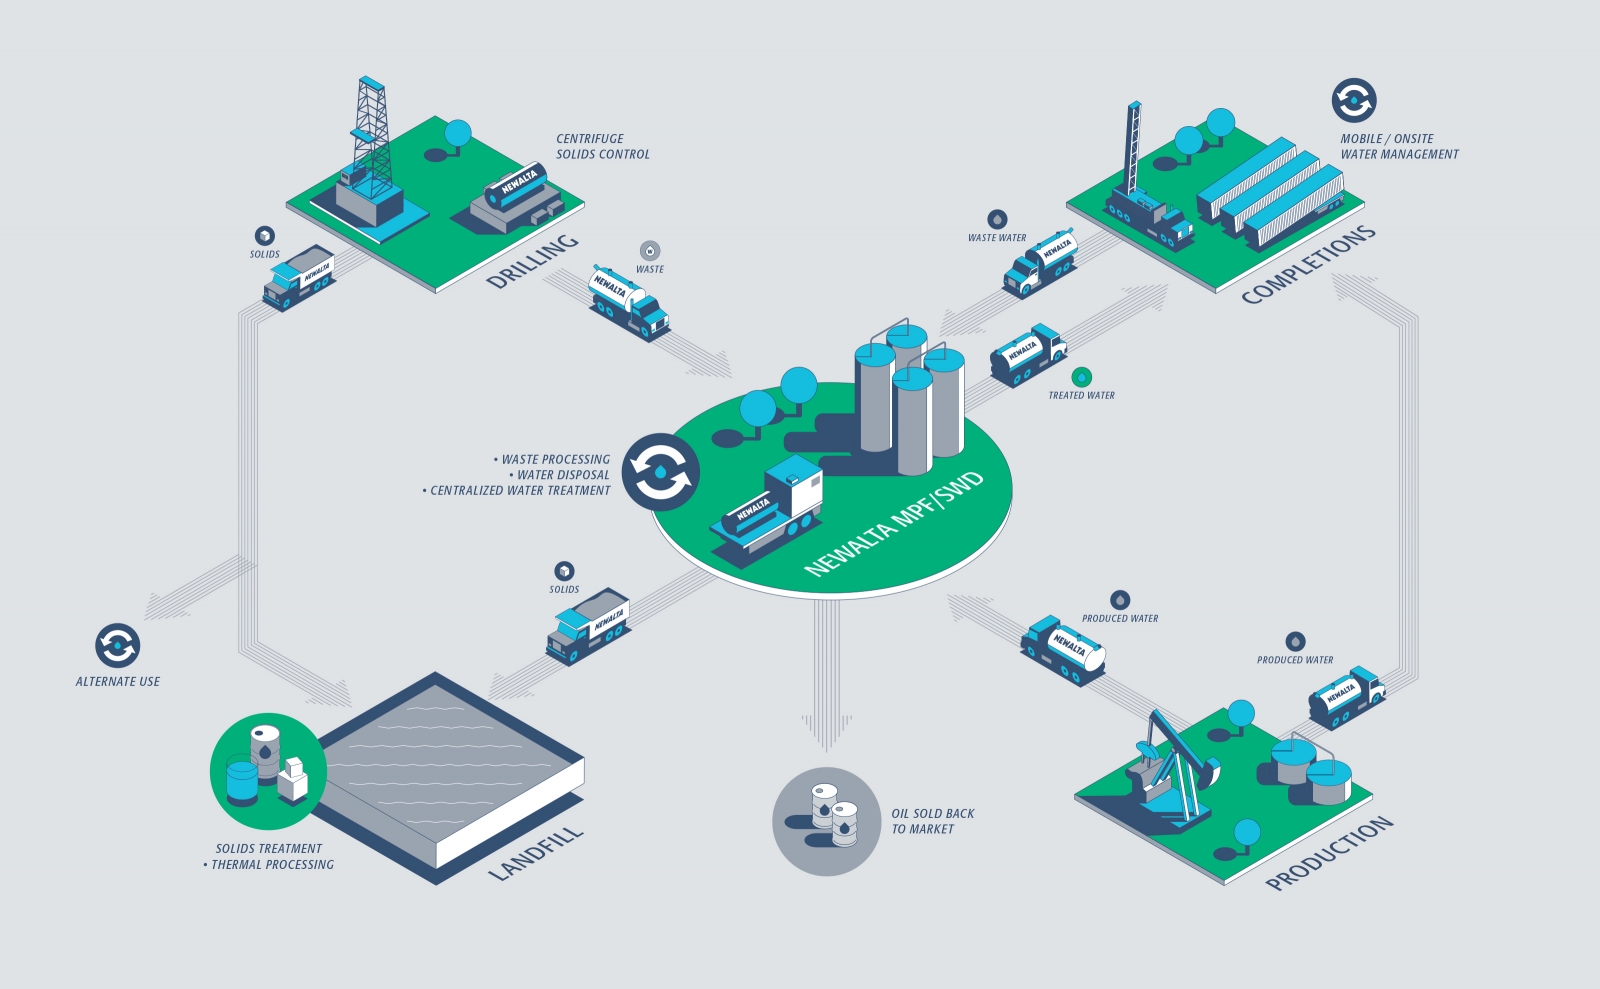
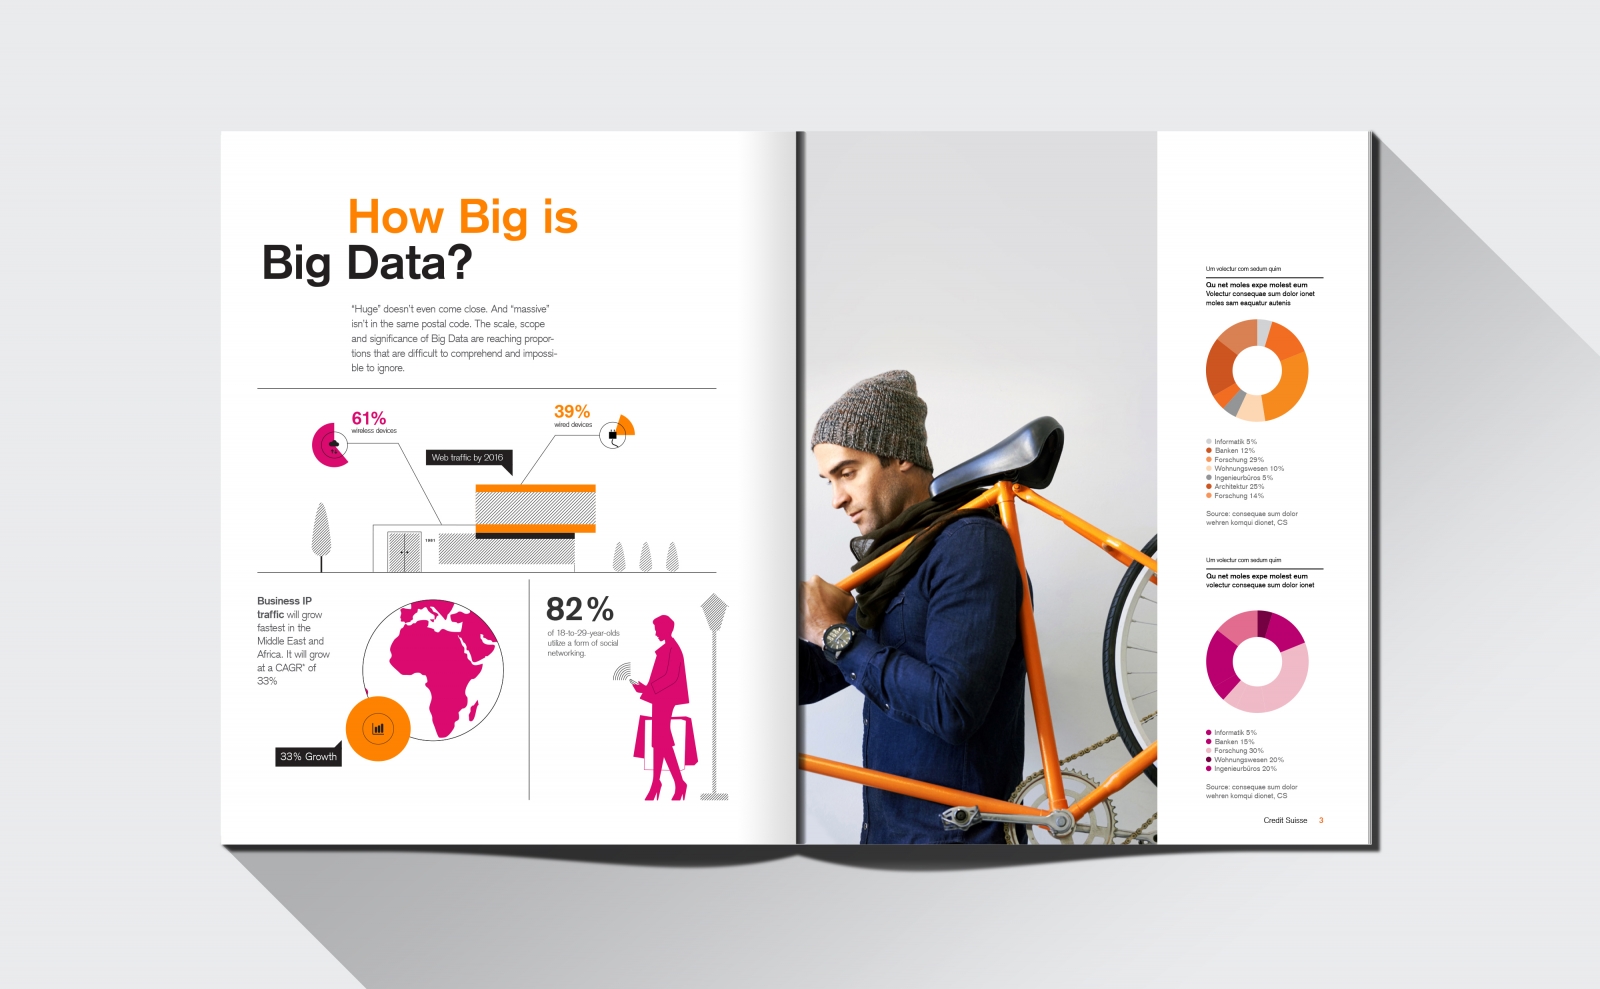
Humanize your data.
Infographics are used when needing to present layered amounts of information in an engaging way. Through the use of symbols, trends and connecting elements, they help to engage the viewer and improve cognitive understanding. They turn data into something we can not only understand, but also connect with.
Filter
Infographics
Style
None
3D
Flat
Platform
None
Digital
Environmental
Print